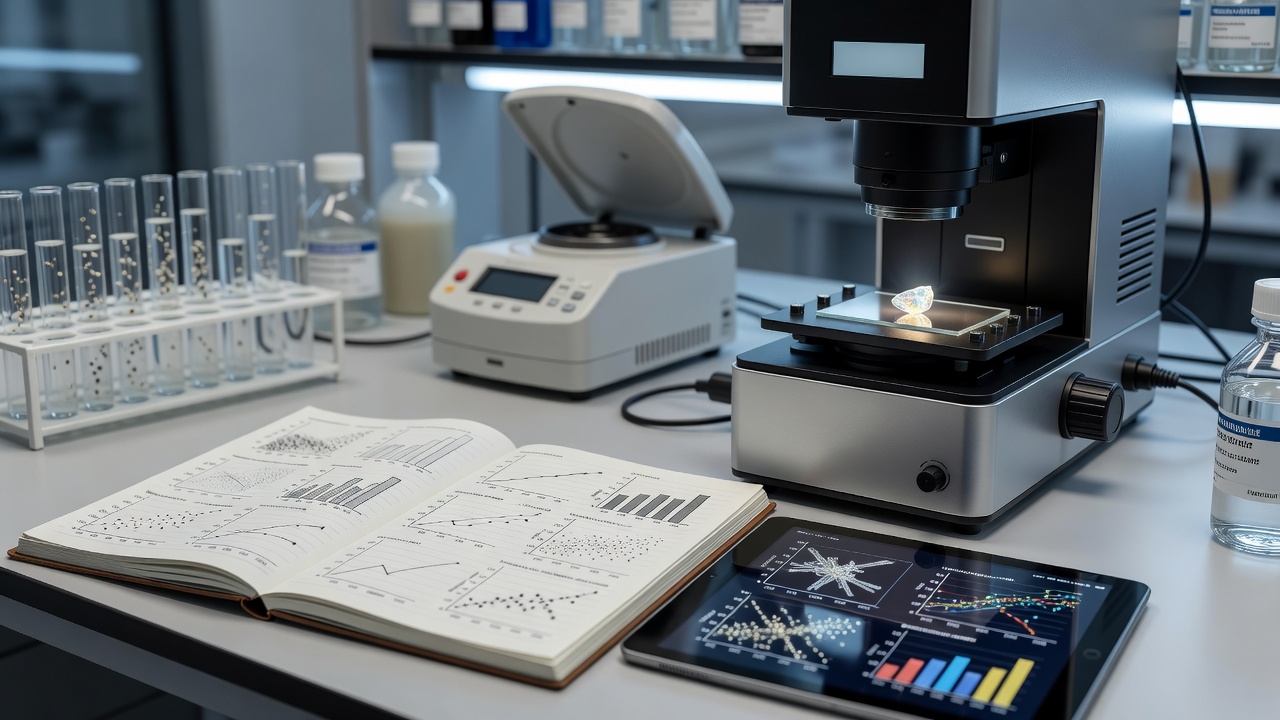
Begin with an operational statement
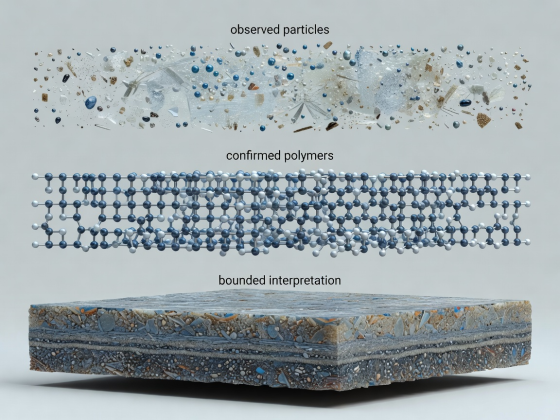
“Microplastics were found” is a starting point, not a complete result. State the matrix, collection approach, analysed size interval and identification method. Distinguish chemically confirmed particles from visually suspected candidates. If the result is polymer mass, name the quantified polymers and the analytical portion to which that mass applies.
A clear statement narrows the claim to the evidence. It also prevents familiar misunderstandings: a filter count is not a whole-water census, a library assignment is not a source attribution, and a positive detection is not a demonstrated health effect.
Attach the right denominator
Particle abundance might be expressed per litre of water, per kilogram of dry sediment or per defined area. Polymer mass uses different units and conveys a different property. State whether sediment mass is wet or dry and explain conversions. Otherwise, apparently similar concentrations can describe substantially different things.
Document sampled volume, recovered material, analysed filter area and any subsampling factor. Extrapolation from a fraction should follow a stated selection design rather than convenience. Preserve the raw observations alongside normalised results so readers can see whether a concentration rests on many identifications or only a few events.
Describe identification decisions
Report the classification workflow, including spectral libraries, acceptance rules and manual review. State how mixed or poor-quality spectra were handled. An unresolved category is informative: it shows where the evidence stopped. Silently discarding unresolved particles can make confirmation rates and apparent composition look stronger than they are.
For automated image or spectral analysis, describe segmentation and quality checks. Touching particles may be merged, one particle may be split, or non-plastic regions may be classified incorrectly. Review suitable reference examples and representative environmental material. Software version and processing choices are part of the method, not incidental technical details.
Show the control results
Blank contamination should be reported with enough detail to evaluate its relevance. A blank dominated by fibres may affect a fibre-rich sample differently from a fragment-rich one. State the number and type of blanks, their findings and any correction rule. Explain negative corrected values or decisions to report results without subtraction.
Include recovery checks and their scope. Recovery from a clean spike does not fully characterise recovery of aged environmental particles, and one polymer’s performance does not guarantee another’s. Where uncertainty cannot be quantified reliably, describe the likely direction and source of bias rather than inventing an overly precise interval.
Keep non-detections specific
A non-detection means the method did not produce a qualifying signal under the applied conditions. It may reflect a low amount, an excluded size range, unsuccessful recovery or an unmeasured polymer. Detection and quantification limits should be defined for the method and matrix; they are not simply a manufacturer’s sensitivity claim.
Do not treat values below a reporting threshold as known zeros without explanation. Decisions about censored data affect averages and comparisons. State the rule and consider whether the available data support the proposed summary. Where methods differ substantially, presenting results side by side may be more honest than pooling them.
Separate environmental presence from risk
Detection establishes presence within a measurement framework. Risk assessment additionally depends on exposure, particle properties, dose, biological context and evidence of effects. An environmental count alone cannot establish an individual’s exposure or diagnose harm. Likewise, failing to detect particles in one sample cannot establish general safety.
Source attribution needs its own evidence. Polymer type, colour and shape may suggest hypotheses, but many products share those features. A credible source investigation considers transport, local activities, reference materials and alternative explanations. Avoid turning a plausible story into a causal conclusion.
Comparisons between places or time points also need comparable sampling and analysis. Differences in lower size thresholds can dominate particle counts. Check method changes before interpreting a trend as environmental change. The reporting and quality-assurance sources provide useful frameworks for making those checks explicit.
- Define the measurand, units and size interval.
- Show confirmed, suspected and unresolved categories.
- Describe blanks, recovery and analysed fractions.
- State what the findings cannot establish.